Send data to Sumo Logic with Sensu
PRO TIP: You can use the Sumo Logic Analytics integration in the Sensu Catalog to send Sensu event data to Sumo Logic instead of following this guide. Follow the Catalog prompts to configure the Sensu resources you need and start processing your observability data with a few clicks.
Follow this guide to create a pipeline that sends data from a Sensu check to Sumo Logic for long-term logs and metrics storage. Sensu checks are commands the Sensu agent executes that generate observability data in a status or metric event. Sensu pipelines define the event filters and actions the Sensu backend executes on the events.
Requirements
To follow this guide, install the Sensu backend, make sure at least one Sensu agent is running, and configure sensuctl to connect to the backend as the admin user.
The examples in this guide rely on the check_cpu check from Monitor server resources with checks.
Before you begin, follow the instructions to add the sensu/check-cpu-usage dynamic runtime asset and the check_cpu check.
Configure a Sensu entity
Sensu checks have a subscriptions attribute, where you specify strings to indicate which subscribers will execute the checks.
For Sensu to execute a check, at least one entity must include a subscription that matches a subscription in the check definition.
In the example in this guide, the check_cpu check includes the system subscription, so at least one entity must subscribe to system to run the check.
First, select the entity whose data you want to send to Sumo Logic. To list all of your entities in the current namespace, run:
sensuctl entity listThe ID in the response is the entity name.
Select one of the listed entities.
Before you run the following sensuctl command, replace <ENTITY_NAME> with the name of your entity.
Then run the command to add the system subscription to your entity:
sensuctl entity update <ENTITY_NAME>- For
Entity Class, press enter. - For
Subscriptions, typesystemand press enter.
Finally, confirm that both Sensu services are running:
systemctl status sensu-backend && systemctl status sensu-agentThe response should indicate active (running) for both the Sensu backend and agent.
Register the dynamic runtime asset
The sensu/sensu-sumologic-handler dynamic runtime asset includes the scripts your handler will need to send observability data to Sumo Logic.
To add the sensu/sensu-sumologic-handler asset, run:
sensuctl asset add sensu/sensu-sumologic-handler:0.3.0 -r sumologic-handlerThis example uses the -r (rename) flag to specify a shorter name for the dynamic runtime asset: sumologic-handler.
The response will indicate that the asset was added:
fetching bonsai asset: sensu/sensu-sumologic-handler:0.3.0
added asset: sensu/sensu-sumologic-handler:0.3.0

You have successfully added the Sensu asset resource, but the asset will not get downloaded until
it's invoked by another Sensu resource (ex. check). To add this runtime asset to the appropriate
resource, populate the "runtime_assets" field with ["sumologic-handler"].
To confirm that the asset was added to your Sensu backend, run:
sensuctl asset info sumologic-handlerThe response will list the available builds for the sensu/sensu-sumologic-handler dynamic runtime asset.
NOTE: Sensu does not download and install dynamic runtime asset builds onto the system until they are needed for command execution.
Set up an HTTP Logs and Metrics Source
Set up a Sumo Logic HTTP Logs and Metrics Source to collect your Sensu observability data.
NOTE: If you have an existing Sumo Logic HTTP Logs and Metrics Source, you can send Sensu data there instead of creating a new source if you wish. Copy the HTTP Source Address URL for your existing source and skip to Add the Sumo Logic handler.
Log in to your Sumo Logic account and follow these instructions:
-
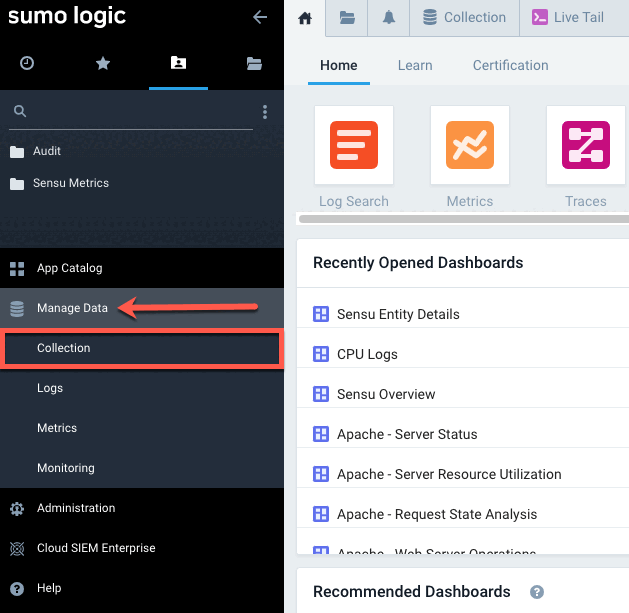
In the Sumo Logic left-navigation menu, click Manage Data and then Collection to open the Collection tab.
-
At the top-right of the Collection tab, click Add Collector.

-
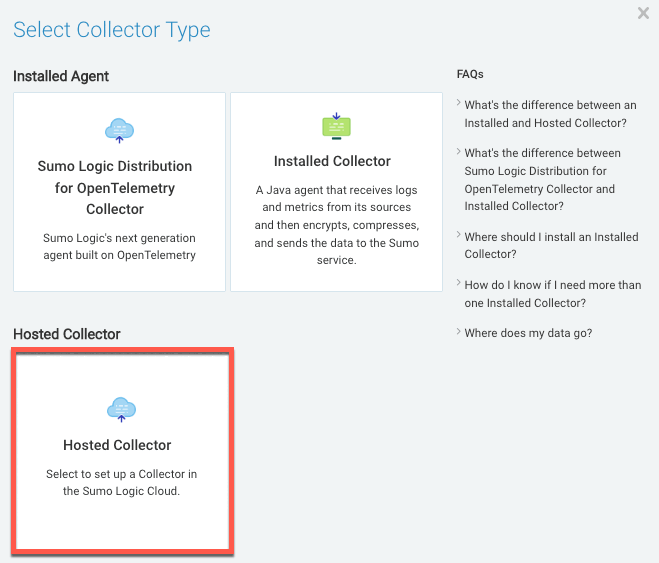
In the Click Selector Type modal window, click Hosted Collector.
-
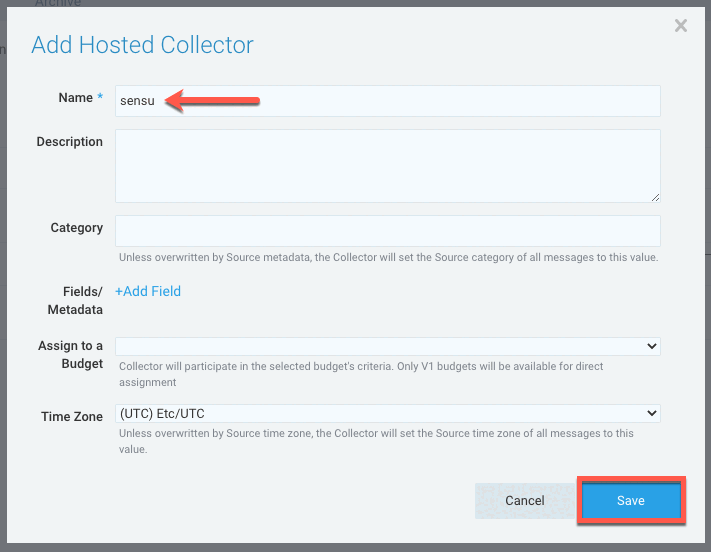
In the Add Hosted Collector modal window:
- Type sensu in the Name field.
- Click Save.
-
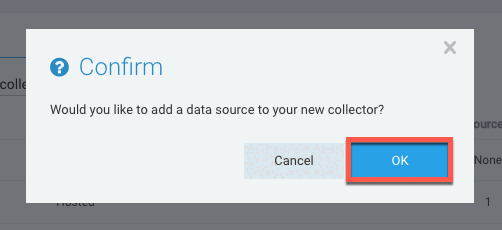
In the Confirm prompt, click OK.
-
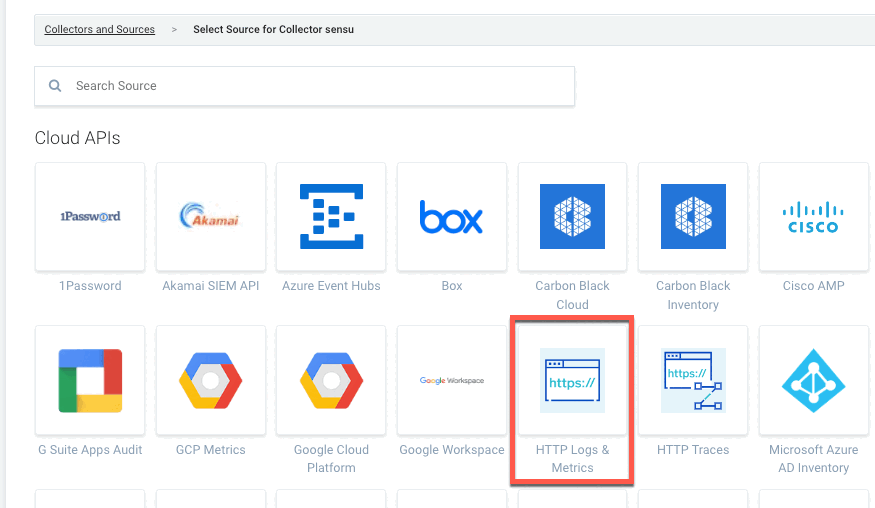
Under Cloud APIs, click HTTP Logs & Metrics.
-
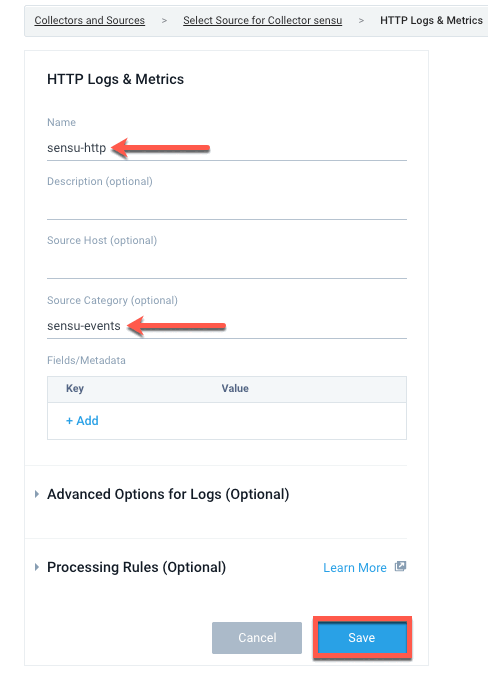
In the HTTP Logs & Metrics form:
- Type sensu-http in the Name field.
- Type sensu-events in the Source Category field.
- Click Save.
-
In the HTTP Source Address prompt, copy the listed URL and click OK. You will use this URL in the next step as the
SUMOLOGIC_URLvalue for the secret in your Sensu handler definition.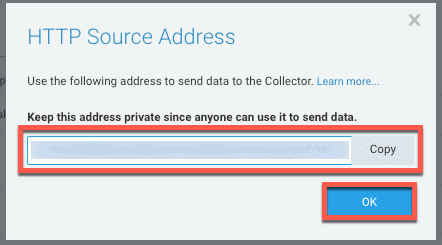
Add the Sumo Logic handler
Now that you’ve set up a Sumo Logic HTTP Logs and Metrics Source, you can create a handler that uses the sensu/sensu-sumologic-handler dynamic runtime asset to send observability data to Sumo Logic.
The Sensu Sumo Logic Handler asset requires a SUMOLOGIC_URL variable.
The value for the SUMOLOGIC_URL variable is the Sumo Logic HTTP Source Address URL, which you retrieved in the last step of setting up an HTTP Logs and Metrics Source.
NOTE: This example shows how to set your Sumo Logic HTTP Source Address URL as an environment variable and use it as a secret with Sensu’s Env secrets provider.
Configure the SUMOLOGIC_URL environment variable
To save your Sumo Logic HTTP Source Address URL as an environment variable:
-
Create the files from which the
sensu-backendservice will read environment variables. If you have already created this file on your system, skip to step 2.sudo touch /etc/default/sensu-backendsudo touch /etc/sysconfig/sensu-backend -
In the following code, replace
<SumoLogic_HTTPSourceAddress_URL>with your Sumo Logic HTTP Source Address URL. Run:echo 'SUMOLOGIC_URL=<SumoLogic_HTTPSourceAddress_URL>' | sudo tee -a /etc/default/sensu-backendecho 'SUMOLOGIC_URL=<SumoLogic_HTTPSourceAddress_URL>' | sudo tee -a /etc/sysconfig/sensu-backend -
Restart the sensu-backend:
sudo systemctl restart sensu-backend
This configures the SUMOLOGIC_URL environment variable to your Sumo Logic HTTP Source Address URL in the context of the sensu-backend process.
Create the Env secret
Create a secret named sumologic_url that refers to the environment variable ID SUMOLOGIC_URL.
Run:
cat << EOF | sensuctl create
---
type: Secret
api_version: secrets/v1
metadata:
  name: sumologic_url
spec:
  id: SUMOLOGIC_URL
  provider: env
EOF
cat << EOF | sensuctl create
{
"type": "Secret",
"api_version": "secrets/v1",
"metadata": {
"name": "sumologic_url"
},
"spec": {
"id": "SUMOLOGIC_URL",
"provider": "env"
}
}
EOFNow you can refer to the sumologic_url secret in your handler to securely pass your Sumo Logic HTTP Source Address URL.
Create a Sumo Logic handler
Run the following command to create a handler to send Sensu observability data to your Sumo Logic HTTP Logs and Metrics Source:
cat << EOF | sensuctl create
---
type: Handler
api_version: core/v2
metadata:
  name: sumologic
spec:
  command: >-
    sensu-sumologic-handler --send-log --send-metrics
    --source-host "{{ .Entity.Name }}"
    --source-name "{{ .Check.Name }}"
  type: pipe
  runtime_assets:
  - sumologic-handler
  secrets:
  - name: SUMOLOGIC_URL
    secret: sumologic_url
EOF
cat << EOF | sensuctl create
{
"type": "Handler",
"api_version": "core/v2",
"metadata": {
"name": "sumologic"
},
"spec": {
"command": "sensu-sumologic-handler --send-log --send-metrics --source-host \"{{ .Entity.Name }}\" --source-name \"{{ .Check.Name }}\"",
"type": "pipe",
"runtime_assets": [
"sumologic-handler"
],
"secrets": [
{
"name": "SUMOLOGIC_URL",
"secret": "sumologic_url"
}
]
}
}
EOFMake sure that your handler was added by retrieving the complete handler definition in YAML or JSON format:
sensuctl handler info sumologic --format yamlsensuctl handler info sumologic --format wrapped-jsonThe response will list the complete handler resource definition:
---
type: Handler
api_version: core/v2
metadata:
  name: sumologic
spec:
  command: sensu-sumologic-handler --send-log --send-metrics --source-host "{{ .Entity.Name }}" --source-name "{{ .Check.Name }}"
  env_vars: null
  filters: null
  handlers: null
  runtime_assets:
  - sumologic-handler
  secrets:
  - name: SUMOLOGIC_URL
    secret: sumologic_url
  timeout: 0
  type: pipe
{
"type": "Handler",
"api_version": "core/v2",
"metadata": {
"name": "sumologic"
},
"spec": {
"command": "sensu-sumologic-handler --send-log --send-metrics --source-host \"{{ .Entity.Name }}\" --source-name \"{{ .Check.Name }}\"",
"env_vars": null,
"filters": null,
"handlers": null,
"runtime_assets": [
"sumologic-handler"
],
"secrets": [
{
"name": "SUMOLOGIC_URL",
"secret": "sumologic_url"
}
],
"timeout": 0,
"type": "pipe"
}
}Create a pipeline with the Sumo Logic handler
With your Sumo Logic handler configured, you can add it to a pipeline workflow. A single pipeline workflow can include one or more event filters, one mutator, and one handler.
To send data for all events (as opposed to only incidents), create a pipeline that includes only the Sumo Logic handler you’ve already configured and the built-in not_silenced event filter — no mutators. To add the pipeline, run:
cat << EOF | sensuctl create
---
type: Pipeline
api_version: core/v2
metadata:
  name: sensu_to_sumo
spec:
  workflows:
  - name: logs_to_sumologic
    filters:
    - name: not_silenced
      type: EventFilter
      api_version: core/v2
    handler:
      name: sumologic
      type: Handler
      api_version: core/v2
EOF
cat << EOF | sensuctl create
{
"type": "Pipeline",
"api_version": "core/v2",
"metadata": {
"name": "sensu_to_sumo"
},
"spec": {
"workflows": [
{
"name": "logs_to_sumologic",
"filters": [
{
"name": "not_silenced",
"type": "EventFilter",
"api_version": "core/v2"
}
],
"handler": {
"name": "sumologic",
"type": "Handler",
"api_version": "core/v2"
}
}
]
}
}
EOFAssign the pipeline to a check
To use the sensu_to_sumo pipeline, list it in a check definition’s pipelines array.
This example uses the check_cpu check created in Monitor server resources, but you can add the pipeline to any Sensu check you wish.
All the observability events that the check produces will be processed according to the pipeline’s workflows.
Assign your sensu_to_sumo pipeline to the check_cpu check to start sending Sensu data to Sumo Logic.
To open the check definition in your text editor, run:
sensuctl edit check check_cpuReplace the pipelines: [] line with the following array:
  pipelines:
  - type: Pipeline
    api_version: core/v2
    name: sensu_to_sumo
To confirm that the updated check_cpu resource definition includes the pipelines reference, run:
sensuctl check info check_cpu --format yamlsensuctl check info check_cpu --format wrapped-jsonThe updated check definition will be similar to this example:
---
type: CheckConfig
api_version: core/v2
metadata:
  created_by: admin
  name: check_cpu
spec:
  check_hooks: null
  command: check-cpu-usage -w 75 -c 90
  env_vars: null
  handlers: []
  high_flap_threshold: 0
  interval: 15
  low_flap_threshold: 0
  output_metric_format: prometheus_text
  output_metric_handlers: null
  pipelines:
  - api_version: core/v2
    name: sensu_to_sumo
    type: Pipeline
  proxy_entity_name: ""
  publish: true
  round_robin: false
  runtime_assets:
  - check-cpu-usage
  secrets: null
  stdin: false
  subdue: null
  subscriptions:
  - system
  timeout: 0
  ttl: 0
{
"type": "CheckConfig",
"api_version": "core/v2",
"metadata": {
"name": "check_cpu",
"created_by": "admin"
},
"spec": {
"check_hooks": null,
"command": "check-cpu-usage -w 75 -c 90",
"env_vars": null,
"handlers": [],
"high_flap_threshold": 0,
"interval": 15,
"low_flap_threshold": 0,
"output_metric_format": "prometheus_text",
"output_metric_handlers": null,
"pipelines": [
{
"api_version": "core/v2",
"name": "sensu_to_sumo",
"type": "Pipeline"
}
],
"proxy_entity_name": "",
"publish": true,
"round_robin": false,
"runtime_assets": [
"check-cpu-usage"
],
"secrets": null,
"stdin": false,
"subdue": null,
"subscriptions": [
"system"
],
"timeout": 0,
"ttl": 0
}
}View your Sensu data in Sumo Logic
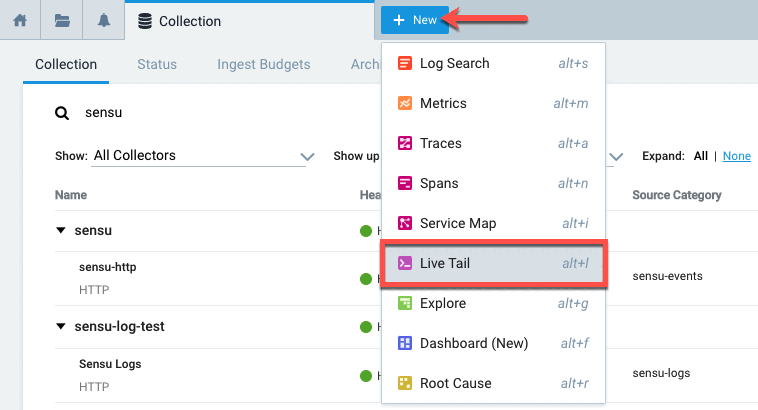
It will take a few moments after you add the pipeline to the check for your Sensu observability data to appear in Sumo Logic. Use the Live Tail feature to confirm that your data is reaching Sumo Logic.
-
In Sumo Logic, click the + New button and select Live Tail from the drop-down menu.
-
In the Live Tail search field, enter
_collector=sensuand click Run.
Within a few seconds, the Live Tail page should begin to display your Sensu observability data.
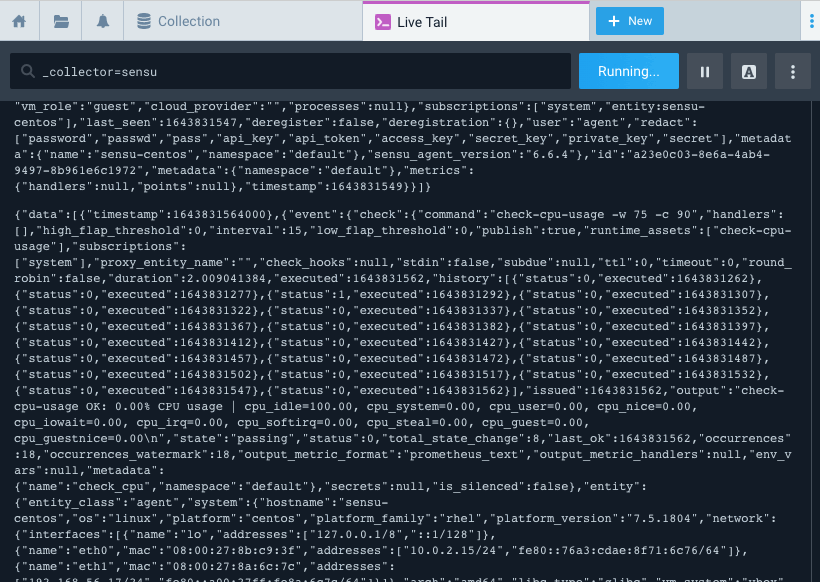
If you see Sensu data on the Live Tail page, well done! You have a successful workflow that sends Sensu observability data to your Sumo Logic account.
What’s next
To share and reuse the check, handler, and pipeline like code, save them to files and start building a monitoring as code repository.
Learn more about the sensu/sensu-sumologic-handler dynamic runtime asset. You can also configure a Sumo Logic dashboard to search, view, and analyze the Sensu data you’re sending to your Sumo Logic HTTP Logs and Metrics Source.
In addition to the traditional handler we used in this example, you can use Sensu Plus, our built-in integration, to send metrics to Sumo Logic with a streaming Sumo Logic metrics handler.
